Cookbook
In this page, we show some example scripts written with mesh_illustris. Feel free to contribute to this cookbook.
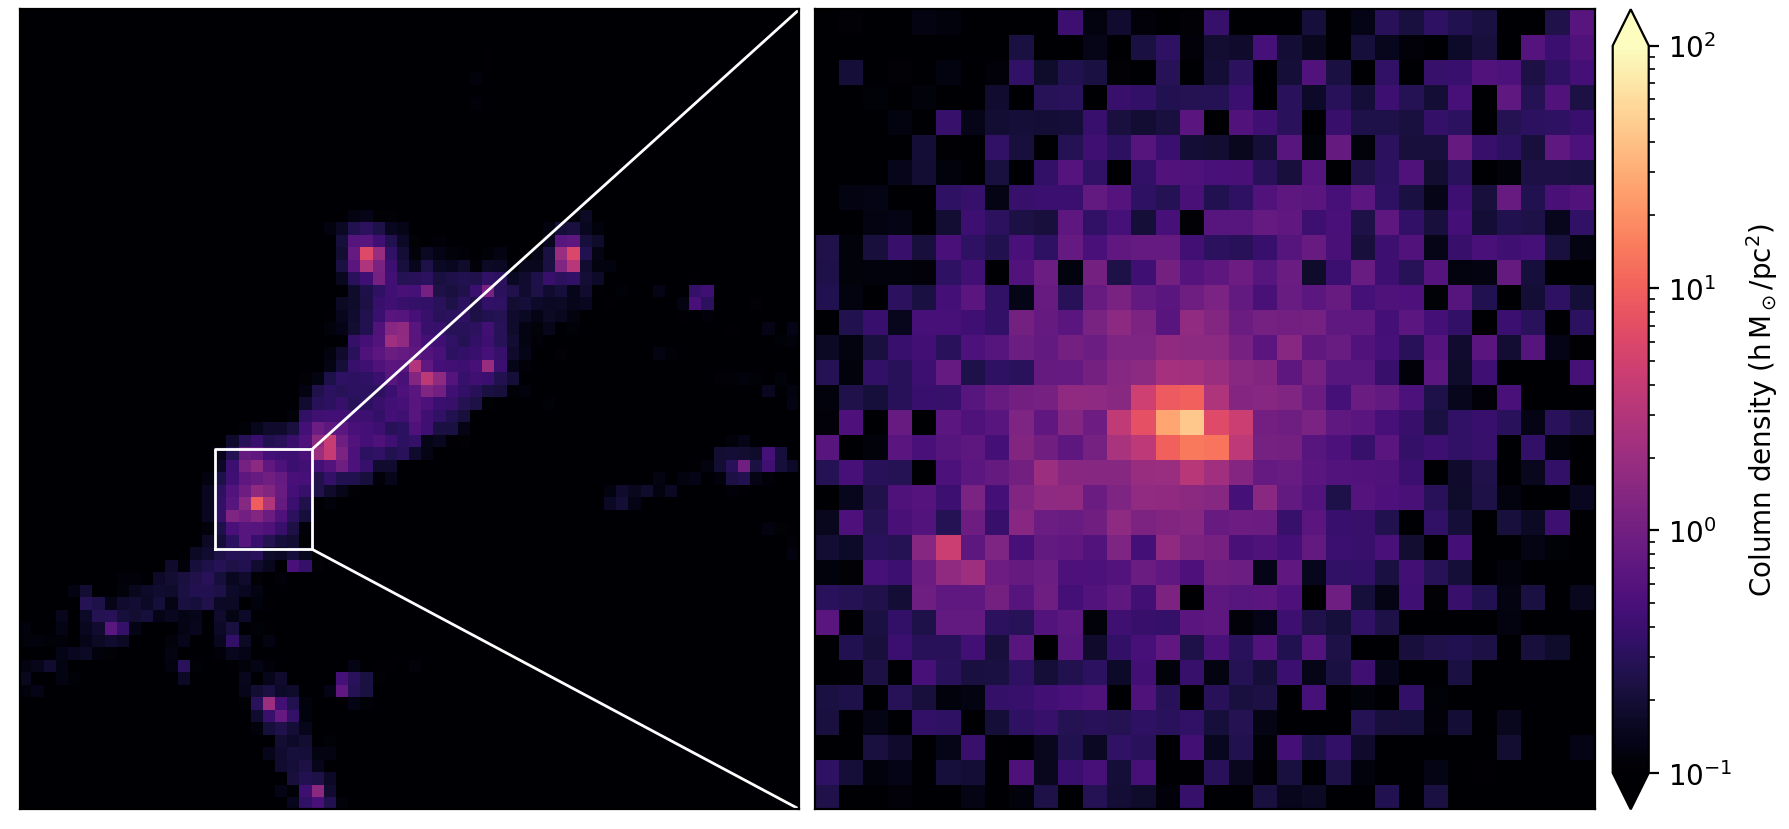
Load a box from TNG50-4-Subbox0
TNG50-4-Subbox0 is a subbox of the TNG50 simulation. The center of this subbox is (26, 10, 26.5) Mpc/h, and the side length is 4 Mpc/h. We first load the entire subbox with the box() method of the Dataset object. Next, we laod a smaller 500 kpc/h box containing a Milky-Way mass galaxy also with the box() method. Finally, we make projection plots of gas for both boxes.
#!/usr/bin/env python3
# -*- coding: utf-8 -*-
# Copyright (c) 2021 Bill Chen
# License: MIT (see LICENSE)

import numpy as np
import matplotlib as mpl
import matplotlib.pyplot as plt
import copy

import mesh_illustris as mi

my_magma = copy.copy(mpl.cm.get_cmap('magma'))
my_magma.set_bad(my_magma(-1))

basePath = "TNG50-4-Subbox0/output" # may alter
d = mi.load(basePath, 2332, ["gas"])

# The center of TNG50-4-Subbox0 is (26, 10, 26.5) Mpc/h
# The side length of TNG50-4-Subbox0 is 4 Mpc/h
boundary = np.array([[24.0, 8.0, 24.5], [28.0, 12.0, 28.5]]) # in Mpc/h
# Note, the internal length unit of TNG is kpc/h
box = d.box(boundary*1000, ["gas"], ["Coordinates", "Masses"])

fig, [ax0, ax1] = plt.subplots(1, 2, figsize=(9,4))
fig.subplots_adjust(wspace=0.02)

x = box["gas"]["Coordinates"][:,0] / 1000 # in Mpc/h
y = box["gas"]["Coordinates"][:,1] / 1000 # in Mpc/h
weights = box["gas"]["Masses"] / (4/64)**2 / 1e2 # in h Msun/pc^2
ax0.hist2d(x, y, norm=mpl.colors.LogNorm(), weights=weights,
	range=[[24.0, 28.0], [8.0, 12.0]], bins=64, cmap=my_magma,
	vmax=1e2, vmin=1e-1)

ax0.plot([25, 25.5, 25.5, 25,25], [9.3, 9.3, 9.8, 9.8, 9.3], c="w", lw=1)
ax0.plot([25.5, 28.0], [9.8, 12.0], c="w", lw=1)
ax0.plot([25.5, 28.0], [9.3, 8.0], c="w", lw=1)

ax0.set_xticks([])
ax0.set_yticks([])

boundary = np.array([[25.0, 9.3, 26.25], [25.5, 9.8, 26.75]]) # in Mpc/h
box = d.box(boundary*1000, ["gas"], ["Coordinates", "Masses"])

x = box["gas"]["Coordinates"][:,0] / 1000 # in Mpc/h
y = box["gas"]["Coordinates"][:,1] / 1000 # in Mpc/h
weights = box["gas"]["Masses"] / (0.5/32)**2 / 1e2 # in h Msun/pc^2
h = ax1.hist2d(x, y, norm=mpl.colors.LogNorm(), weights=weights,
	range=[[25.0, 25.5], [9.3, 9.8]], bins=32, cmap=my_magma,
	vmax=1e2, vmin=1e-1)

ax1.set_xticks([])
ax1.set_yticks([])

plt.subplots_adjust(bottom=0, right=1, top=1)
cax = plt.axes([1.01, 0, 0.02, 1])
cbar = plt.colorbar(h[3], cax=cax, extend="both")
cbar.set_label(r"Column density $({\rm h\,M_\odot/pc^2})$")

plt.savefig('figures/load_box.png', bbox_inches ='tight',
	pad_inches=0.05, dpi=200)